As of 10-22-2024, The Survey is at Version 3-1 running from Amazon S3. It now includes the entire contiguous United States. Please grab a new link from the 2nd download icon below. Don't forget to flush cache in Google Earth if you have been running the older version of the Survey recently. Should any large "X" occur in your field of view, it is likely because of a change made to the survey on our end. Please run through the CACHE FLUSH sequence and load again. Another occasional issue is having the ground data from Google Earth appear "above" the bare earth elevation map. This is likely because the viewer has been set to present Google "3D" data, which is buildings and trees. Not all areas have 3D data, so the experience will vary from place to place. Just turn off "3D Buildings" in the layers panel.
Amazon has recently alerted me that some users of the Survey are running older Google Earth clients that do not support the 1.2 or 1.3 Transport Level Security protocols. Google Earth has been supporting the higher levels for the past 3 years, so there is good reason in that alone to grab a new copy of Google Earth for your system. Its free, and getting it now will allow you to avoid having your requests against the Survey's S3 bucket denied - although Amazon has not yet stated the drop-dead-date.
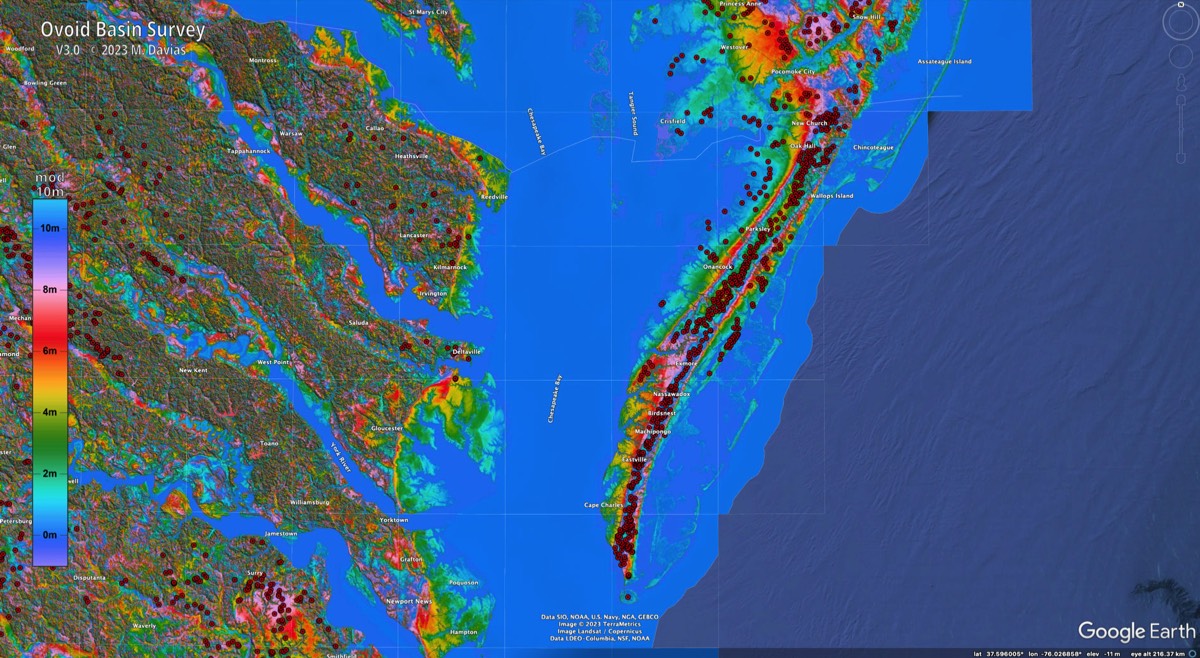
The Survey was renamed as an "Ovoid Basin Survey", effective with the V3.0 release. That release includes seamless coverage across the 48 contiguous United States. The change is to attach a common landform name for the slightly diverse ovoid planforms seen when considering the Carolina Bays, High Plains Playas and the Rainwater Basins of Nebraska.
The survey project and all my scientific endeavors are entirely privately funded.
Cintos is the author's nom de plume. I have utilized Cintos as a handle, username and domain name for my internet presence since the 1990's.
Michael Davias 203-705-9272
Send me an email
MY ORCID ID:
 https://orcid.org/0000-0002-8960-4075
Access to the High resolution Topology Models (HRTMs) is provided from an Amazon S3 cloud bucket, for which I am charged for storage and bandwidth. Should you find these resources to be of value, I'd appreciate a small donation to help me defray the costs.

This work is licensed under a Creative Commons Attribution 4.0 International License.
Geological Research by Cintos is licensed under a Creative Commons Attribution-NonCommercial-ShareAlike 3.0 Unported License.
Based on a work at Cintos.org.
Permissions beyond the scope of this license may be available at http://cintos.org/about.html.
Survey Database in Excel
Visualization Tool Using Google Earth
Spatial maps are assembled as quadrangles 1º of Longitude wide and 1º of Latitude high - as currently described by the USGS - and are our top-most organizational element. In order to provide reasonable sized elements for high resolution LiDAR-quality maps (1 to 3 meter grids), we have subdivided each quadrant into sixteen (16) 15 Minute (15' / 0.25º) quadrangles.
At V3.0, the survey was offering 1.2m resolution HRTMs across the entire contiguous United States. Approximately 75% is at a resolution of 1.2 m or 1.5 m, while the remainder is at 10m. The survey is updated quickly when the USGS or other agency provides additional bare earth LiDAR elevation datasets. The coverage of the "basin & range" and Northern Rocky Mountains is probably the most poorly LiDAR-covered.
At V3.1 the survey offers 1.0m resolution HRTMs across the contiguous United States. Approximately 85% is currently at a resolution of 1m, while the remainder is at 10m. The survey is updated quickly when the USGS or other agency provides additional bare earth LiDAR elevation datasets. The USGS is releasing a prolific quantity or 1m LiDAR monthly, and we endeavor to incorporate those data into the seamless HRTM imagery facility within a week after availability.
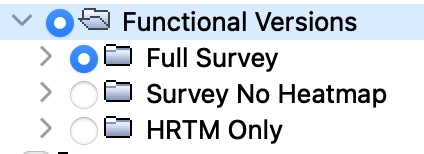
V3.1 delivers a choice of three different viewing experiences.
- the original survey format with a simple heat map for identifying basins we have surveyed and documented.
- the original survey format without the heat map. This is helpful when viewing the KML with an iOS mobile phone Google Earth app, as the heat map has occasionally interfered with the full-resolution imagery.
- An exclusive HRTM imagery version to enhance HRTM-only viewing, without measured basins' placemarks/outlines, heat maps or quadrangle outlines.
By refreshing this link, the latest version available can be accessed. When renewing your copy, it may be best to flush the cache on your Google Earth instance to prompt access to new version of these files. As of March 2023, the survey has identified, measured and mapped over 70,000 basins.
The current HRTM maps use a 10-meter cyclic perceptive color ramp, which provides a relative elevation reading for the local terrain, as each color re-appears every 10 meters. Just as importantly, the rendering adds "hill shade" to produce a 3D effect through shadows. Considering we are focusing here on subtle landscape features, that hill shade is exaggerated 20x compared to normal sun shadow. In effect, a 5 meter hill will cast a shadow as if it was 100 meters tall. The downside is that terrain details of steep slopes on a high mountain's shadow side get lost in the shade.
A single-cycle color-to-elevation is provided as a screen overlay, providing a relative index for the elevation values. Each color is provided as a "modulo 10 m" value, allowing a quick assessment of the fine elevation details when viewing flat terrain. The Google Earth elevation value is typically within a meter or two of the USGS-provided value, which should be referenced to advise the actual elevation above sea level.
Metrics: as of October 2024, the survey's High Resolution Topographical Models (HRTMs) encompasses seamless coverage for 940 USGS 1º quadrangles across the entire contiguous United States. Within each of those quadrangles, most have sixteen 15 minute quadrangles (15'), yielding a net of 14,000 quadrants (some 15' USGS scopes include Atlantic and Gulf coastal waters with no LiDAR). ~75% of the active 15 minute quadrangles contain LiDAR resolution data, rendered at 1 meter horizontal grid resolution, each requiring ~160 raster tiles for Google Earth presentation. 3-meter and 10-meter data is used for the remainder, and they require far lower number of tiles. The total jpeg tile count is currently ~2,660,000 which occupy ~ 1.8 Terabytes of data storage in an Amazon S3 cloud bucket.
The new Survey's visualization using the KMZ approach may well overload a mobile device or a smaller desktop computer, although I have taken pains to design it to avoid that.
I'd appreciate any feedback you may be willing to share using the comment function below, or by reaching out via email to the link provided art end.
The next images will walk you through use of the above link's kmz in Google Earth.
When first opened, the user will be presented with a heat map of bays within regions the Survey covers at present. The relative number of bays in each 15' quadrant is portrayed using a slightly logarithmic color ramp.
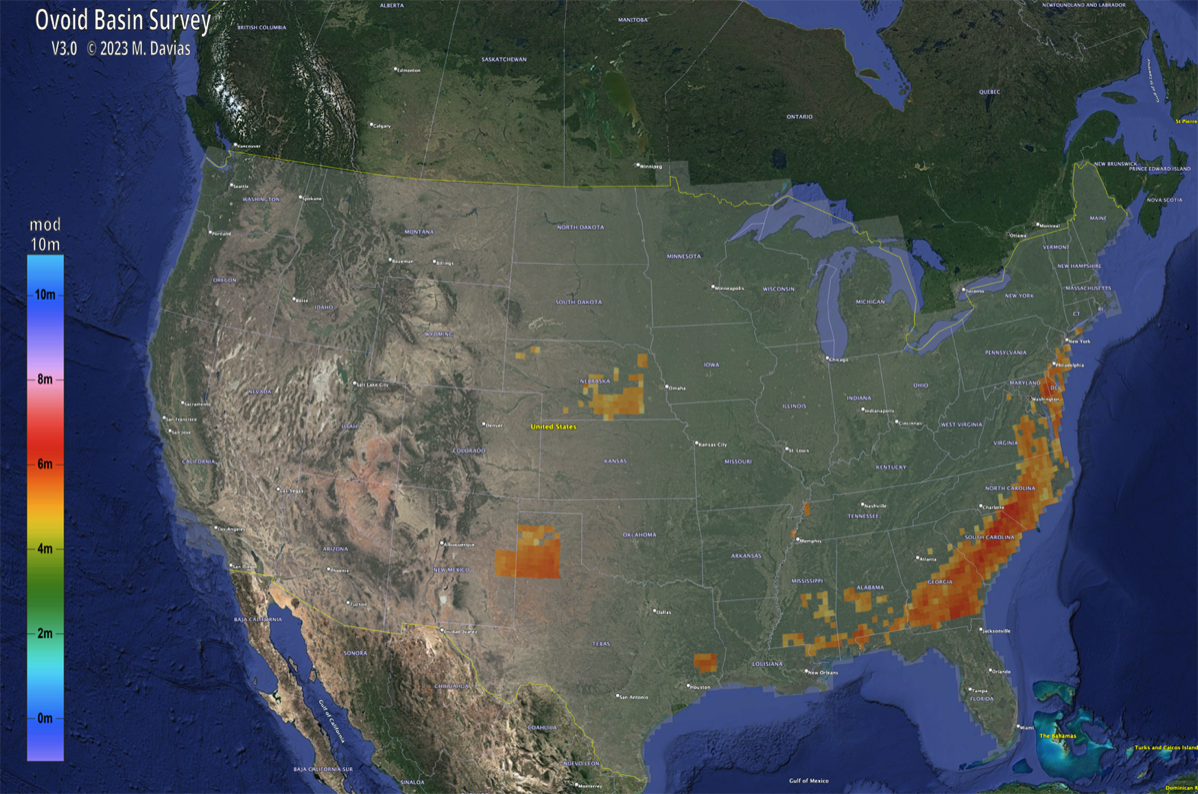
Zooming in further and the 15' heat map can be resolved. This provides rough clue to the number of bays in a given area.
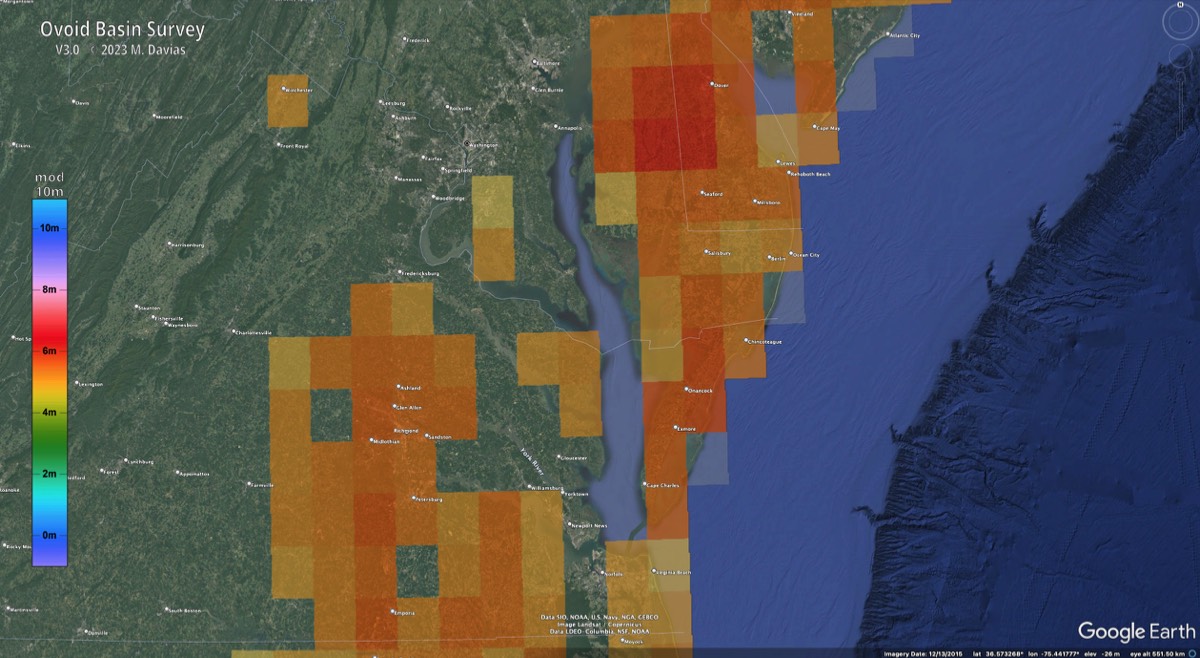
Zooming in further enables placemarks to appear for the top 10% (by size) of bays in the 15' quad. This provides rough clue to the number of bays in a given area. The faint outline of the 15' quad's boundaries are visible.
Next up is the display of hsv-shaded digital elevation maps. These are regionalized, so will become higher resolution as the viewer zooms further in. This version of my LiDAR elevation model utilizes a color ramp enhanced for human perception and cycles every 10 meters. Thus, the ocean (@ 0 meters) and the uplands along the lower spine of the peninsula (@ ~10 meters) both show in blue. This creates a built-in correlation legend between elevation and color, and (importantly) puts all the "pool-table-flat" areas at the same color. That helps them stand out, because that is where the bays are - even far inland on terrace remnants.
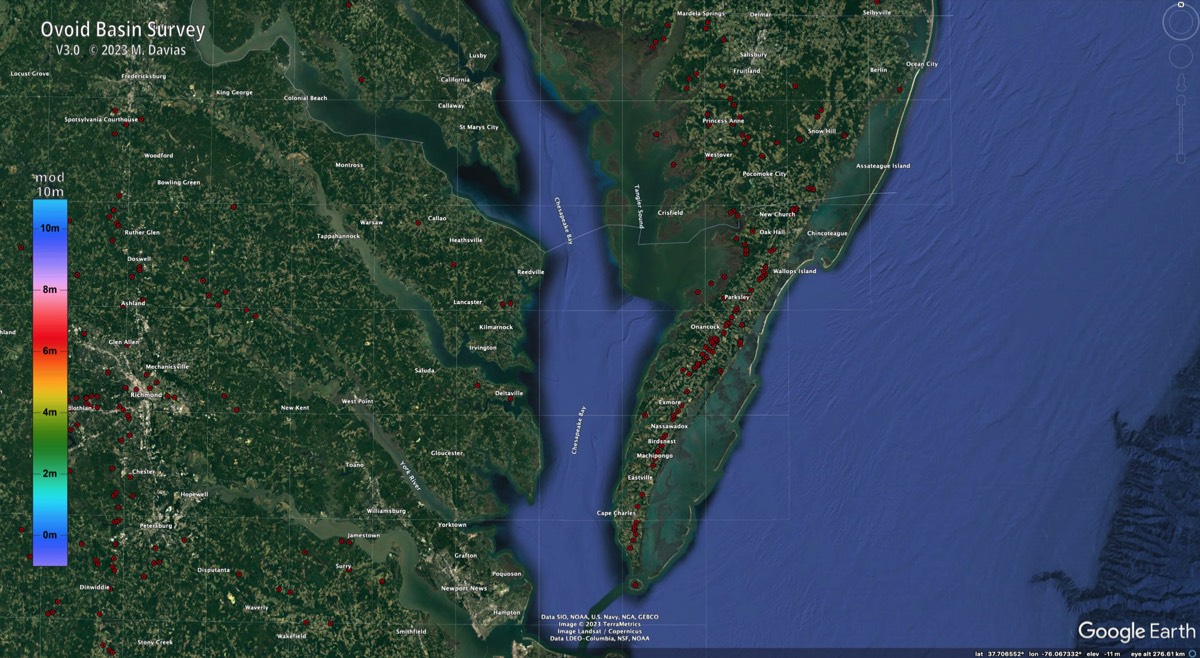
Further in, the Survey KMZ enables the next 40% of bays by size. This regionalization by field-of-view minimizes the network and computer resources needed to present the survey data. From this altitude, you can begin to see not only the placemarks, but the Survey's archetype planform fitted to the bay's rim.
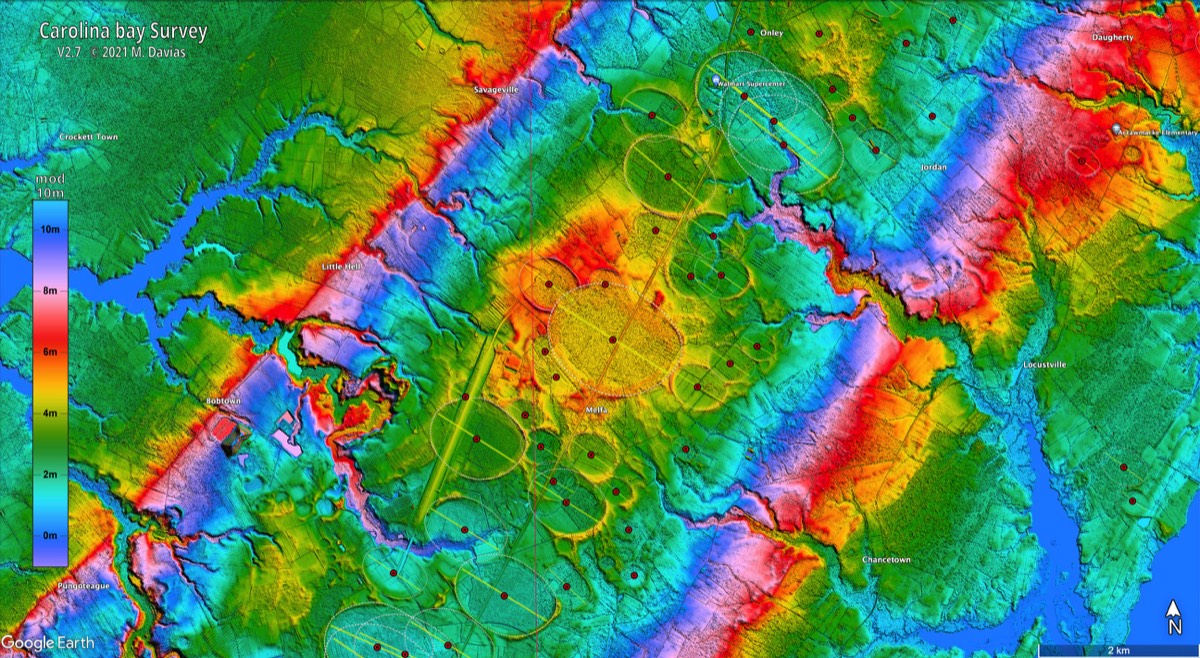
Above, you can see bays that do not have placemarks. Those are in the bottom ~50% of bays by size in this field-of-view. Zooming in further, those are now reveled.
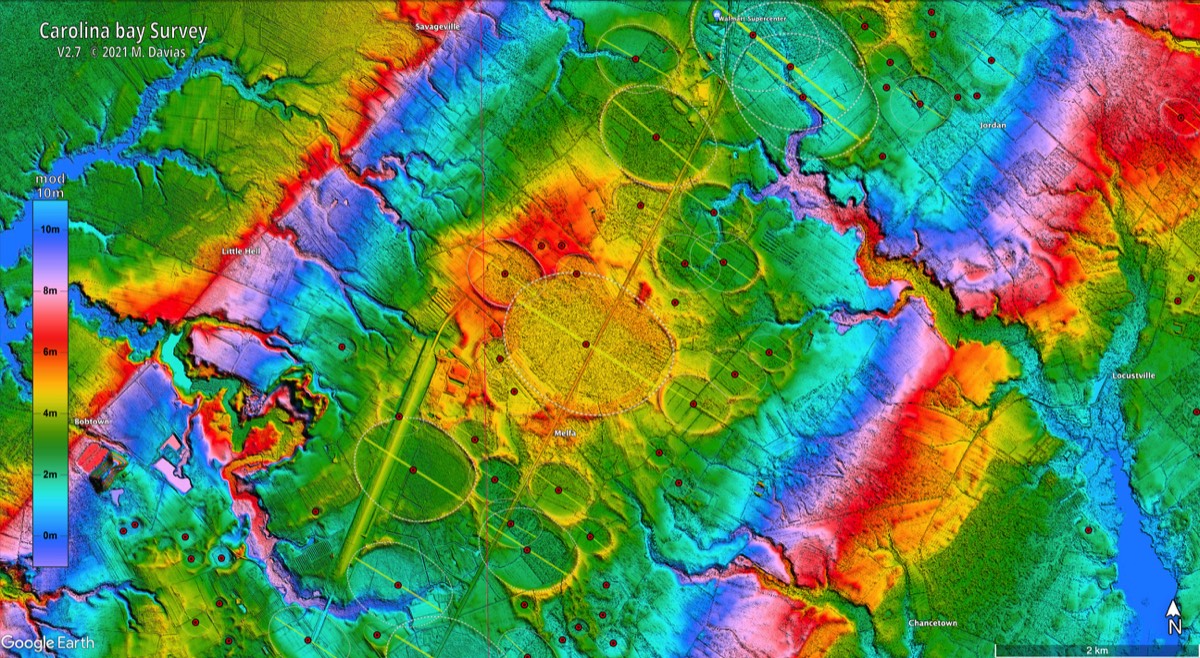
Each placemark can be clicked to present a pop-up description window. The metrics shown are derived from specialized processing of the planform's Google Earth fitted overlay.
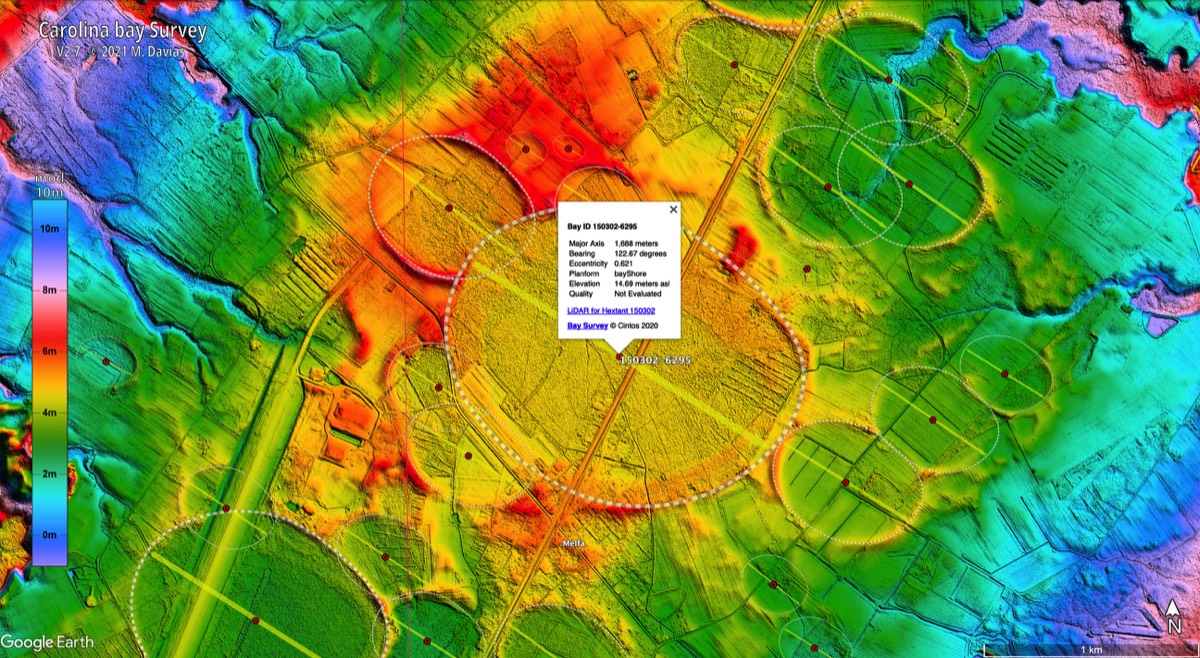
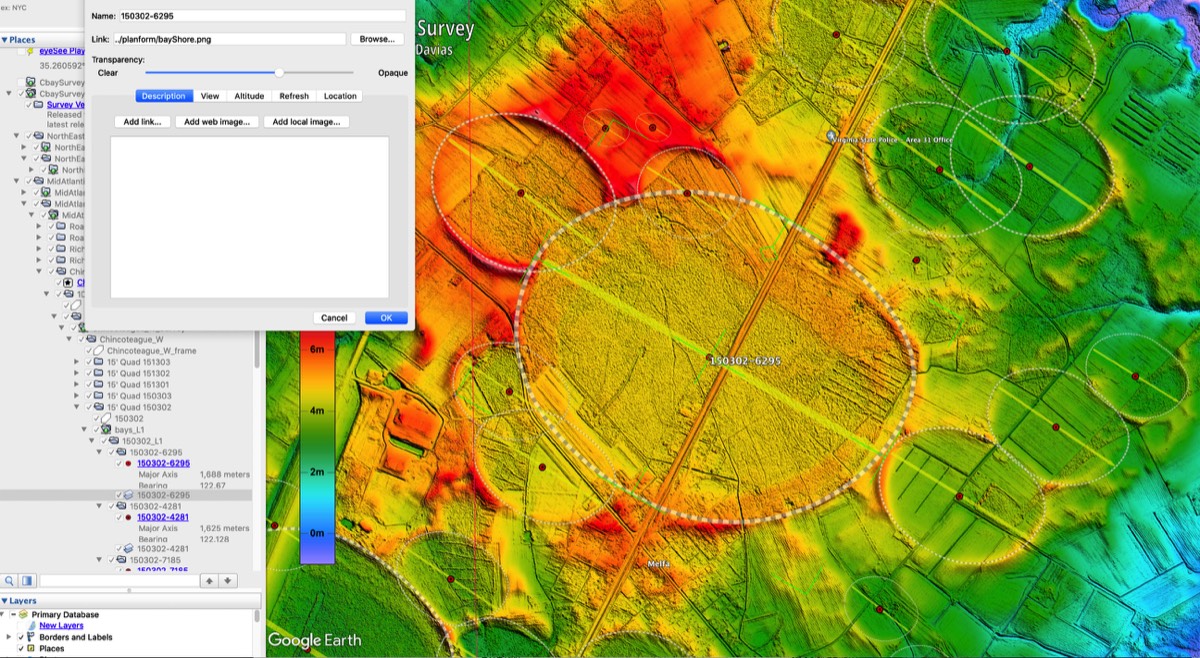
Google Earth's user interface includes the DOM, or Directory of Metadata, on the left side. When expanded, it displays the hierarchy of the regionalized KMZ structure. By selecting an item on the Google Earth image, such as the placemark, then right-clicking to obtain the dropdown menu, by choosing "Get Info" (mac), or "Properties" (windows), the DOM will reveal the specific overlay used to measure the bay.
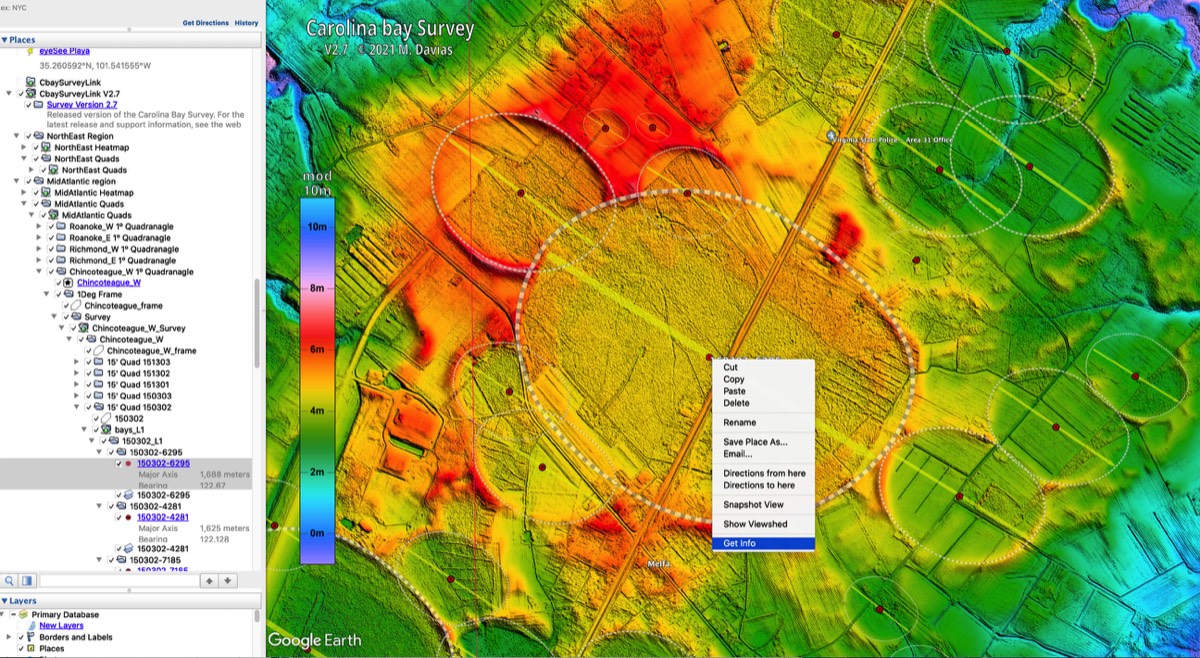
The overlay can be turned on or off, made more or less transparent, or be modified by the user to fit their subjective interpretation of its fit to the bay rim as reveled in the elevation map display by putting it into edit mode

This work is licensed under a Creative Commons Attribution 4.0 International License.
Geological Research by Cintos is licensed under a Creative Commons Attribution-NonCommercial-ShareAlike 3.0 Unported License.
Based on a work at Cintos.org.
Permissions beyond the scope of this license may be available at http://cintos.org/about.html.
The survey project and all my scientific endeavors are entirely privately funded.
Cintos is the author's nom de plume. I have utilized as a handle, username and domain name for my internet presence since the 1990's.
Michael Davias cell 203-705-9272
Send me an email
MY ORCID ID: